The Portfolio Page
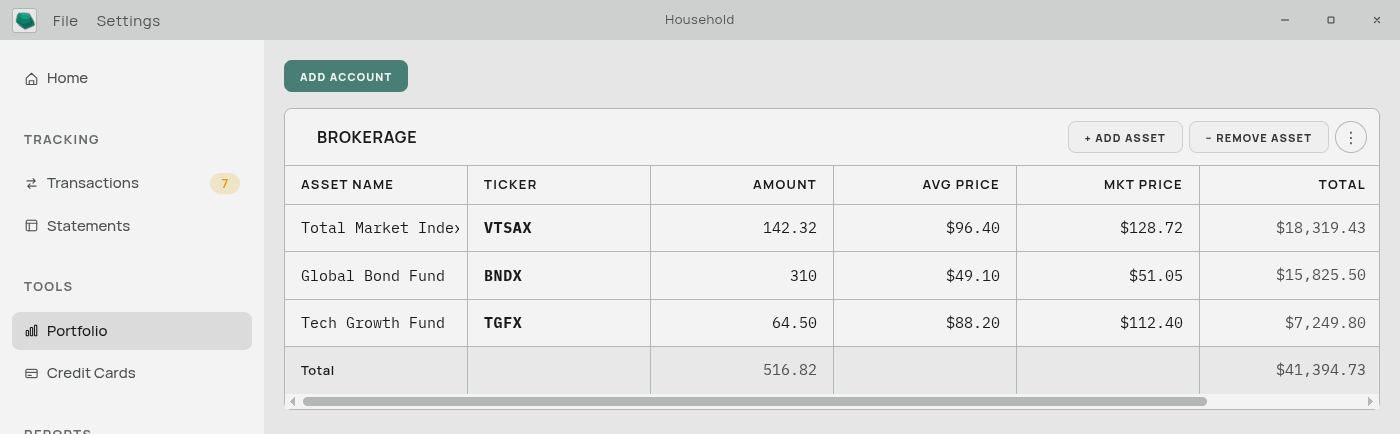
A place to list what you hold and see what it is worth. One table per account, one row per asset.
This is a manual tracker. Aventurine does not fetch prices — it makes no network connections at all. You type in the market price you want it to use, and update it when you feel like it.
Accounts
Add Account creates a table. Each table has a name and a ⋮ menu:
| Item | What it does |
|---|---|
| Rename Table | Change the account name. |
| Duplicate Table | Copy the account and every asset in it, named ”… (Copy)”. Useful for modelling a change without disturbing the original. |
| Delete Table | Remove the account and all its assets, after a confirmation. |
Columns
| Column | Meaning |
|---|---|
| Asset Name | Whatever you call it. |
| Ticker | The symbol. Automatically upper-cased. |
| Amount | How many shares or units you hold. |
| Avg Price | What you paid per unit, on average — your cost basis per unit. |
| Market Price | What one unit is worth now. You keep this current. |
| Total | Amount × Market Price. Calculated; you cannot type in it. |
| ROI | The percentage change from Avg Price to Market Price. Calculated. |
Total and ROI update as you type.
The totals row
Along the bottom:
- Total Amount across all assets.
- Total market value — the sum of every asset’s Total.
- Portfolio ROI — total market value against total cost basis, where cost basis is the sum of Amount × Avg Price. This is a proper value-weighted figure, not an average of the per-row percentages, so a large holding influences it more than a small one.
The Ticker, Avg Price, and Market Price cells in the totals row are deliberately blank, because averaging them would not mean anything.
Adding and removing assets
+ Add Asset appends an empty row. − Remove Asset removes rows after a confirmation.
Everything saves as you type, shortly after you stop.
Precision
Amount, Avg Price, and Market Price are stored exactly as you enter them, including fractional shares and sub-cent prices. They are not rounded to two decimal places the way money elsewhere in the app is, because share counts and unit prices legitimately need more precision.
Working in the table
It behaves like a spreadsheet — arrow keys, block selection, copy and paste, including pasting a block straight out of Excel. See Working in the Tables.
How this relates to the rest of the app
It does not feed the dashboard. Net Worth and the Capital Snapshot read your Balance Sheet, not this page. Portfolio is a detailed breakdown that stands on its own.
If you want your investments in your net worth, put the account’s value into an Investment column on your Balance Sheet each month. Many people use Portfolio to work out that number and then type the total into the Balance Sheet.
It does not affect your transactions. Buying shares shows up in your ledger as a transfer out of your checking account — that is a separate record of the money moving. See Money In Money Out and Transfers.
Related: The Statements Page · Working in the Tables